haveged - A simple entropy daemon
Processor Flutter - Part 3
The numerical results of the R analysis in part 2 are summarized below:
| Processor | bogomips | Log Mean | Log SD | Log 1st Q | Log 3rd Q | Mean | 1st Q | 3rd Q |
|---|---|---|---|---|---|---|---|---|
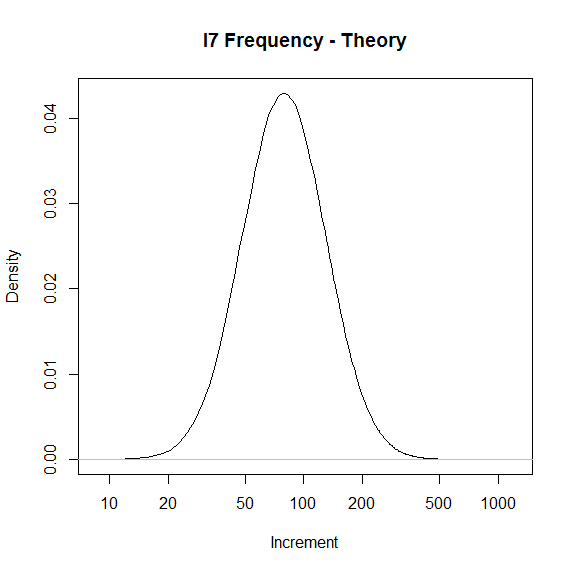
| I7 | 6731.54 | 2.006 | 0.2162 | 1.851 | 2.161 | 101 | 71 | 145 |
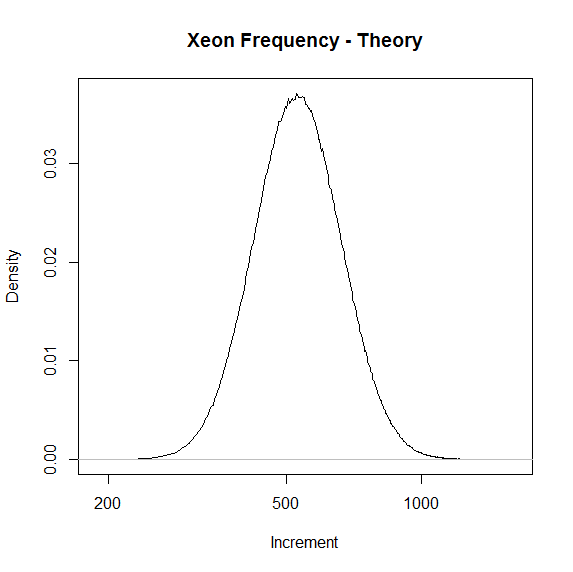
| Xeon | 5984.78 | 2.745 | 0.098 | 2.681 | 2.799 | 556 | 480 | 630 |
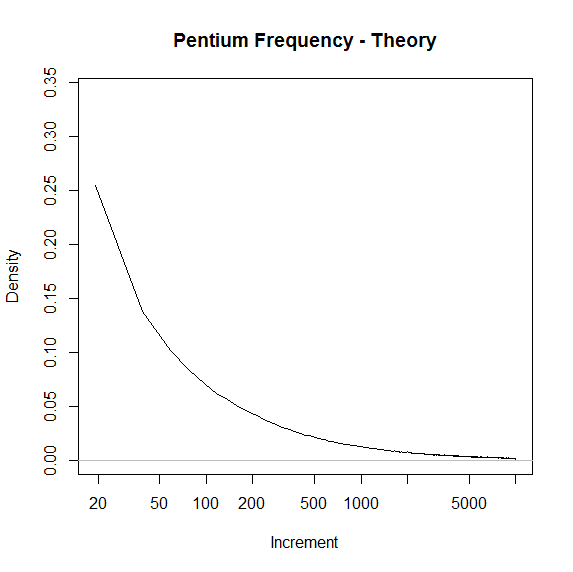
| Pentium | 4793.92 | 5.984 | 2.4142 | 4.724 | 7.827 | 963,829 | 52,966 | 67,142,855 |
The "INJECT" feature of the haveged diagnostic build can be used to verify the sanity check on the previous conclusions. Injection replaces haveged timer readings with values read from an input file. This produces output which can then be analyzed by the usual tools used to validate haveged output. In particular, CAPTURE data can be injected into haveged to indeed insure that the data sequence does pass the haveged statistical tests (ent and a subset of the NIST test).
The CAPTURE data in three test cases above pass both ent and NIST tests. The log-normal proposition can be tested by replacing the CAPTURE data with the proposed distribution. This is done by generating a normal distribution using the mean and sd values tablulated below in R and then saving the anti-log (10^value) of the value in an injection file.
Data thus synthesized for three test cases above also passes both ent and NIST tests. The synthesized distributions are shown below using a log scale. Even with the log scale compression, the tail of the Pentium distribution had to be trimed to show any detail. This exaggerates the y axis of that plot by a factor of roughly 10.
Conclusions
The results contain encouragement that the haveged noise source does have the characteristics of a distribution created as the product of independent timing effects. This result must be tempered with the obvious appearance of “edge” effects which in the Pentium case seem to be comparable to the actual timing variation. More secure conclusions must await a more detailed analysis of the havege “whitener” to determine the actual uncertainty/bit of the output.